Spectra
This submodule contains pattern spectra related functions.
Example
>>> import sap
>>> import numpy as np
>>> from matplotlib import pyplot as plt
>>> image = np.arange(100 * 100).reshape(100, 100)
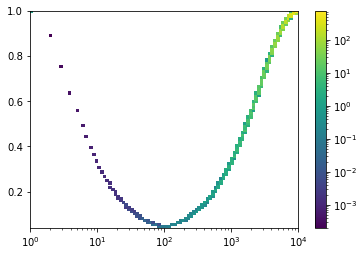
Create the pattern spectrum (PS) of image with attributes area and compactness with the max-tree.
>>> tree = sap.MaxTree(image)
>>> ps = sap.spectrum2d(tree, 'area', 'compactness', x_log=True)
>>> sap.show_spectrum(*ps)
- sap.spectra.get_bins(x, count=10, space='lin', outliers=0.0)[source]
Return the bin edges over the values of x.
- Parameters
x (ndarray) – The values to be binned.
count (int, optional) – Bin count to be returned. Default is 10.
space (str, optional) – Spacing rule used to compute the bin. Can be ‘lin’ for linear spacing (default) or ‘geo’ for logarithmic spacing.
outliers (float, optional) – Extremum quantiles to be considered as outliers to remove from the values before computing the bins.
- Returns
bin_edges – The edges defining the bins.
- Return type
ndarray, shape(count + 1,)
See also
get_spaceReturn spaced numbers with min and max values.
- sap.spectra.get_space(vmin, vmax, thresholds=10, space='lin')[source]
Return spaced numbers over the range defined by vmin and vmax.
- Parameters
vmin (scalar) – The min value of the range.
vmax (scalar) – The max value of the range.
thresholds (int, optional) – The count of samples to be returned. Default is 10.
space (str, optional) – Spacing rule used to compute the samples. Can be ‘lin’ for linear spacing (default) or ‘geo’ for logarithmic spacing.
- Returns
samples – Spaced numbers over the range defined by vmin and vmax.
- Return type
ndarray, shape(thresholds,)
See also
get_binsReturn the bin edges of a distribution.
Notes
When using ‘geo’ spacing, the range cannot include 0. The function will offset
vminto 0.1 ifvminis 0, as a workaround.
- sap.spectra.spectrum2d(tree, x_attribute, y_attribute, x_count=100, y_count=100, x_log=False, y_log=False, weighted=True, normalized=True)[source]
Compute 2D pattern spectrum.
- Parameters
tree (sap.trees.Tree) – The tree used for creating the pattern spectrum.
x_attribute (str) – The name of the attribute to be used on the x-axis.
y_attribute (str) – The name of the attribute to be used on the y-axis.
x_count (int, optional) – The number of bins along the x-axis. Default is 100.
y_count (int, optional) – The number of bins along the y-axis. Default is 100.
x_log (bool, optional) – If
True, the x-axis will be set to be a log scale. Default isFalse.y_log (bool, optional) – If
True, the y-axis will be set to be a log scale. Default isFalse.weighted (bool, optional) – If
True, the pattern spectrum is weighted. Each node of the tree will be weighted according to its size. This is the normal behaviour of pattern spectrum. IfFalsethe spectrum is not weighted, the output is a 2D histogram counting the number of nodes. Default isTrue.normalized (bool, optional) – If
True, the weights of the spectrum are normalized with the size of the image. IfFalseorweightedisFalse, the spectrum is not normalized. Default isTrue.
- Returns
s (ndarray, shape(x_count, y_count)) – The pattern spectrum.
xedges (ndarray, shape(x_count + 1,)) – The bin edges along the x-axis.
yedges (ndarray, shape(y_count + 1,)) – The bin edges along the y-axis.
x_log (bool) – The parameter x_log indicating if the x-axis is a log scale.
y_log (bool) – The parameter y_log indicating if the y-axis is a log scale.
See also
sap.trees.available_attributesList the name of available attributes.
- sap.spectra.show_spectrum(s, xedges, yedges, x_log, y_log, log_scale=True)[source]
Display a pattern spectrum with matplotlib.
- Parameters
s (ndarray) – The pattern spectrum.
xedges (ndarray) – The bin edges along the x-axis.
yedges (ndarray) – The bin edges along the y-axis.
x_log (bool) – Parameter indicating if the x-axis is a log scale.
y_log (bool) – Parameter indicating if the y-axis is a log scale.
log_scale (bool) – If
True, the colormap use a log scale. Default isTrue.
See also
spectrum2dCompute a 2D pattern spectrum.
Examples
>>> import numpy as np
>>> from matplotlib import pyplot as plt
>>> import sap
Create a toy image, compute the “area” and “compactness” pattern spectrum with the tree of shape of the image.
>>> image = np.arange(100 * 100).reshape(100, 100)
>>> tree = sap.TosTree(image)
>>> ps = sap.spectrum2d(tree, 'area', 'compactness', x_log=True)
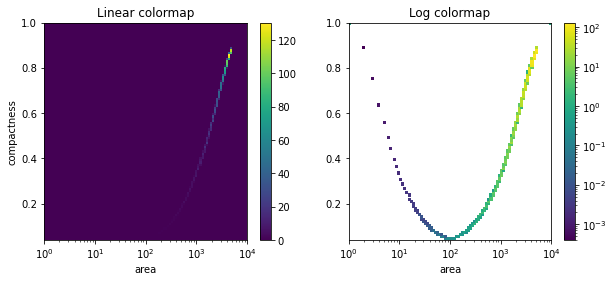
Setup a matplotlib figure with 2 subplots.
>>> plt.figure(figsize=(10,4))
>>> plt.subplot(1, 2, 1)
Draw the spectrum with a linear color map.
>>> sap.show_spectrum(*ps, log_scale=False)
Decorate the subplot.
>>> plt.colorbar()
>>> plt.xlabel('area')
>>> plt.ylabel('compactness')
>>> plt.title('Linear colormap')
>>> plt.subplot(1, 2, 2)
Draw the spectrum with a log color map (default).
>>> sap.show_spectrum(*ps)
Decorate the subplot.
>>> plt.colorbar()
>>> plt.xlabel('area')
>>> plt.title('Log colormap')
Display the figure.
>>> plt.show()